A trader adds a 20-day moving average to a chart.
The stock rises above the line. He buys.
It falls below the line. He sells.
It rises above again. He buys back.
Three trades later, the stock is roughly where it started.
His account isn’t.
“Moving averages don’t work,” he says.
I think that conclusion is too simple.
A moving average can help you follow a trend. In a ranging market, the same line can lead you into one false signal after another.
The question isn’t just whether moving averages work.
It’s whether the market is doing the job you hired the moving average to detect.
What Is a Moving Average in Trading?
A moving average takes a stock’s recent prices and turns them into a smoother line.
A 20-day moving average uses the last 20 trading days. As each new day arrives, the oldest day drops out of the calculation.
That’s it.
The line helps you see the general direction without reacting to every small price change.
Think of it like checking your average driving speed during a journey. It can tell you whether you’ve generally been moving quickly or slowly.
It cannot tell you what’s around the next corner.
That distinction matters. A moving average is calculated from prices that have already happened. It can help describe a trend and provide a rule for responding to it. It cannot predict that the trend will continue.
Why Moving Averages Make Sense in a Trending Market
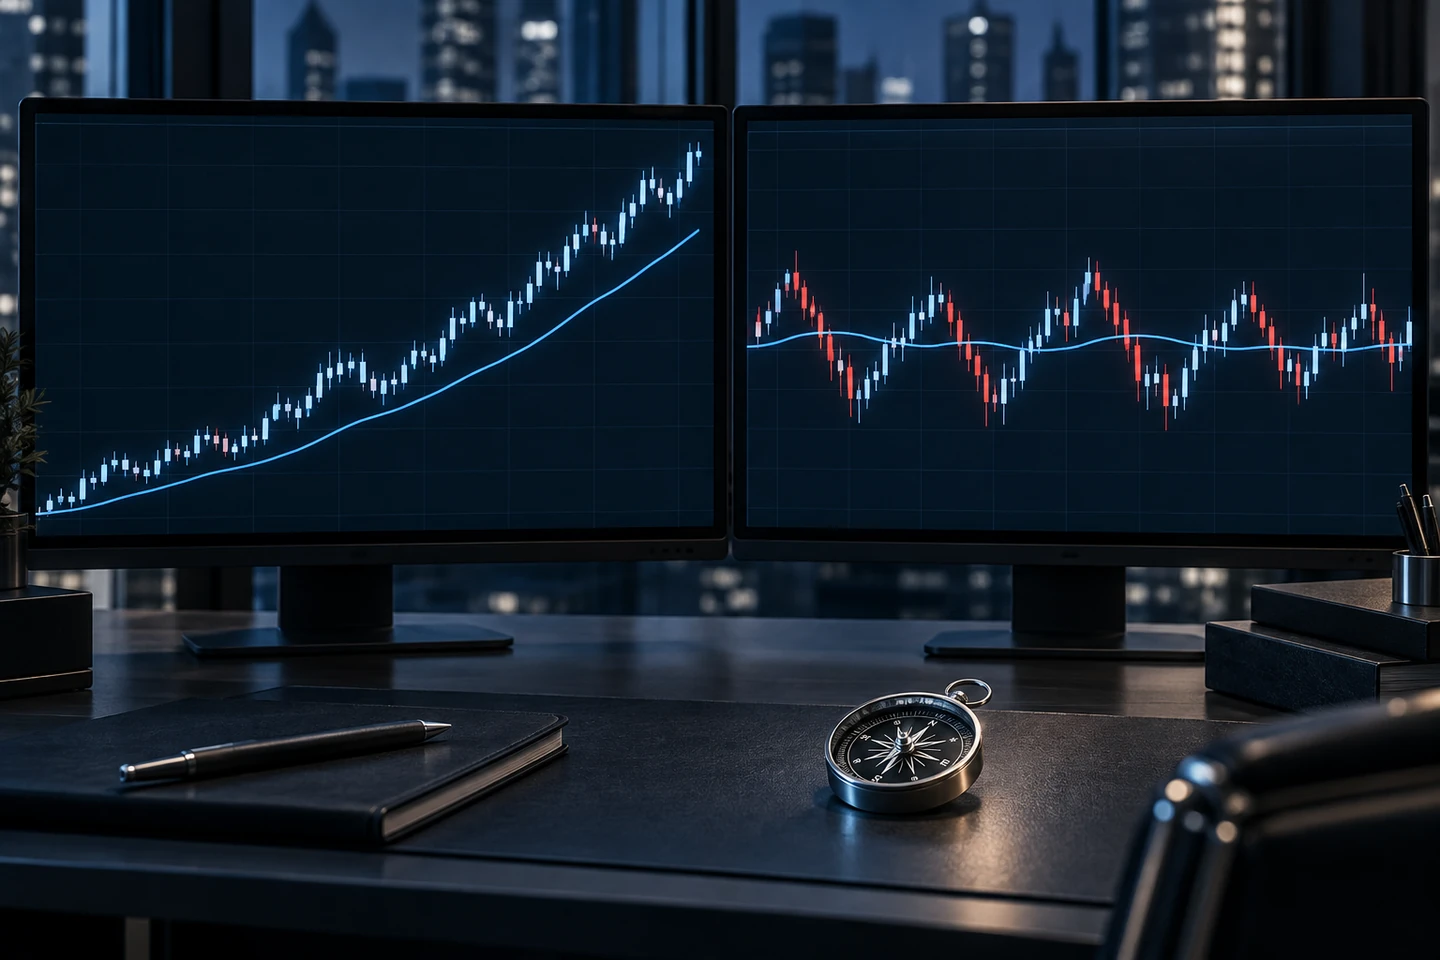
Imagine a stock climbing from $50 to $70 over several months.
It doesn’t travel in a straight line. It rises, pauses, pulls back and rises again.
A trader who reacts to every red candle may sell during the first ordinary pullback. A moving average can help that trader see that, despite the day-to-day movement, price is still advancing over time.
That is where I find moving averages useful: they can give a trend trader a consistent reference point.
If price remains mostly above a rising moving average, that may support the view that the uptrend is intact. If the stock repeatedly closes below it and the line starts turning down, that may prompt a review.
Notice the words support and review.
A touch of the line is not a guaranteed buying opportunity. A close below it is not proof the stock is about to collapse.
The line helps you ask a better question:
“Is this an ordinary pullback within my trend, or has the behaviour I’m trading begun to change?”
Schwab describes moving-average crossovers as a way to assess potential entries and exits. Potential is doing important work in that sentence.
What Changes in a Ranging Market?
Now imagine the stock spending two months between $48 and $52.
It rises toward $52, falls toward $48, then repeats.
The moving average sits somewhere near the middle.
Price crosses above it. Then below it. Then above it again.
If your rule is “buy every cross above and sell every cross below,” the chart can keep inviting you to buy after a rise and sell after a fall.
The problem is clear once you step back: you’re using a trend-following signal when there is no sustained trend to follow.
Fidelity notes a similar whipsaw problem for MACD, an indicator built from moving averages: during trading ranges, its lines can cross back and forth repeatedly.
Here’s my analogy.
A moving average is like a compass on a road trip.
If you’re travelling north, it helps you notice when you’ve begun heading in the wrong direction.
If you’re driving laps around a roundabout, the needle keeps changing direction. The compass isn’t broken. You just aren’t travelling anywhere in a sustained direction.
That is what a ranging chart can do to a moving-average trading rule.
So Do Moving Averages “Only” Work in Trends?
I’d sharpen my own take here.
Moving averages are most useful as trend-following tools when a meaningful trend exists. In a range, they can still tell you something: a flat line with price repeatedly crossing it is a useful warning that trend-following signals may be unreliable.
What they generally cannot do is turn a sideways market into a trending one.
This is why changing the settings often disappoints traders.
The 20-day average gives too many signals, so they try the 50-day.
That reacts too slowly, so they try the 21-day exponential average.
Then the 13-day. Then two lines instead of one.
A different setting changes when the signals appear. It doesn’t solve the basic problem of asking a trend-following rule to find a trend in a range.
How I Would Use a Moving Average
For swing trading, I would give the moving average one clear job: help me judge trend direction and the health of a pullback.
Before considering a long trade, I’d look beyond whether price is above a line:
- Is the moving average rising, or mostly flat?
- Is the stock making progress through higher highs and higher lows?
- Are pullbacks holding, or does price keep crossing back and forth through the line?
- Is there enough room between a sensible entry and the price that would invalidate my setup?
Those questions keep the moving average in context.
Suppose a stock is above a rising 20-day average, pulls back, then resumes climbing. That may be a setup worth assessing under a defined strategy.
Suppose another stock crosses above a flat 20-day average for the fifth time in six weeks. That looks less like a fresh trend and more like another trip across the middle of a range.
Same indicator.
Different market behaviour.
Different decision.
What About the 20-Day, 50-Day and 200-Day Moving Averages?
People often ask which moving average is best.
I don’t think there is one magic number.
A shorter average responds faster, which can help you notice a change sooner. It will also tend to react to more small fluctuations.
A longer average is smoother, but it responds later.
The right choice depends on the timeframe you trade, what you want the line to tell you, and whether your rules hold up across enough trades after costs.
Don’t choose a moving average because it fits the last winning chart beautifully. It is easy to draw a perfect-looking line through a move that has already happened.
Choose its job first. Then test whether it helps you make better decisions across many charts, including the ugly ones.
Research on technical trading rules shows that transaction costs can materially reduce moving-average strategy returns. A good-looking sequence of signals is not, by itself, evidence of profitable trading.
The Mistake Is Treating the Line as the Strategy
A moving average does not know why a stock is rising.
It does not know whether earnings are tomorrow.
It does not know how much you can afford to lose.
And it does not know whether today’s dip is a routine pullback or the start of a much larger decline.
Those are decisions you still have to make.
A workable plan needs an entry condition, an invalidation point, position sizing and a rule for what you do when the market turns sideways. The moving average can help with that plan. It cannot replace it.
Final Thoughts
So, do moving averages work?
Yes, they can help you recognise and manage trends. But a simple moving-average signal often becomes noisy when price is stuck in a range.
That doesn’t make the indicator useless.
A rising line with price making steady progress tells you one thing. A flat line that price crosses every few days tells you another.
The mistake is demanding the same action from both charts.
Before asking which moving average to use, ask the more important question:
“Is this market actually trending—or am I following a line around a roundabout?”