"Both fell. One of them has to be the bargain, right?"
That is the question every trader asked on Thursday night. It sounds like logic. It is not. Two stocks can fall on the same day for different reasons.
Jason stared at his phone on Thursday night. Nvidia was down 9.26%. AMD was down 17.26%. His group chat was already decided.
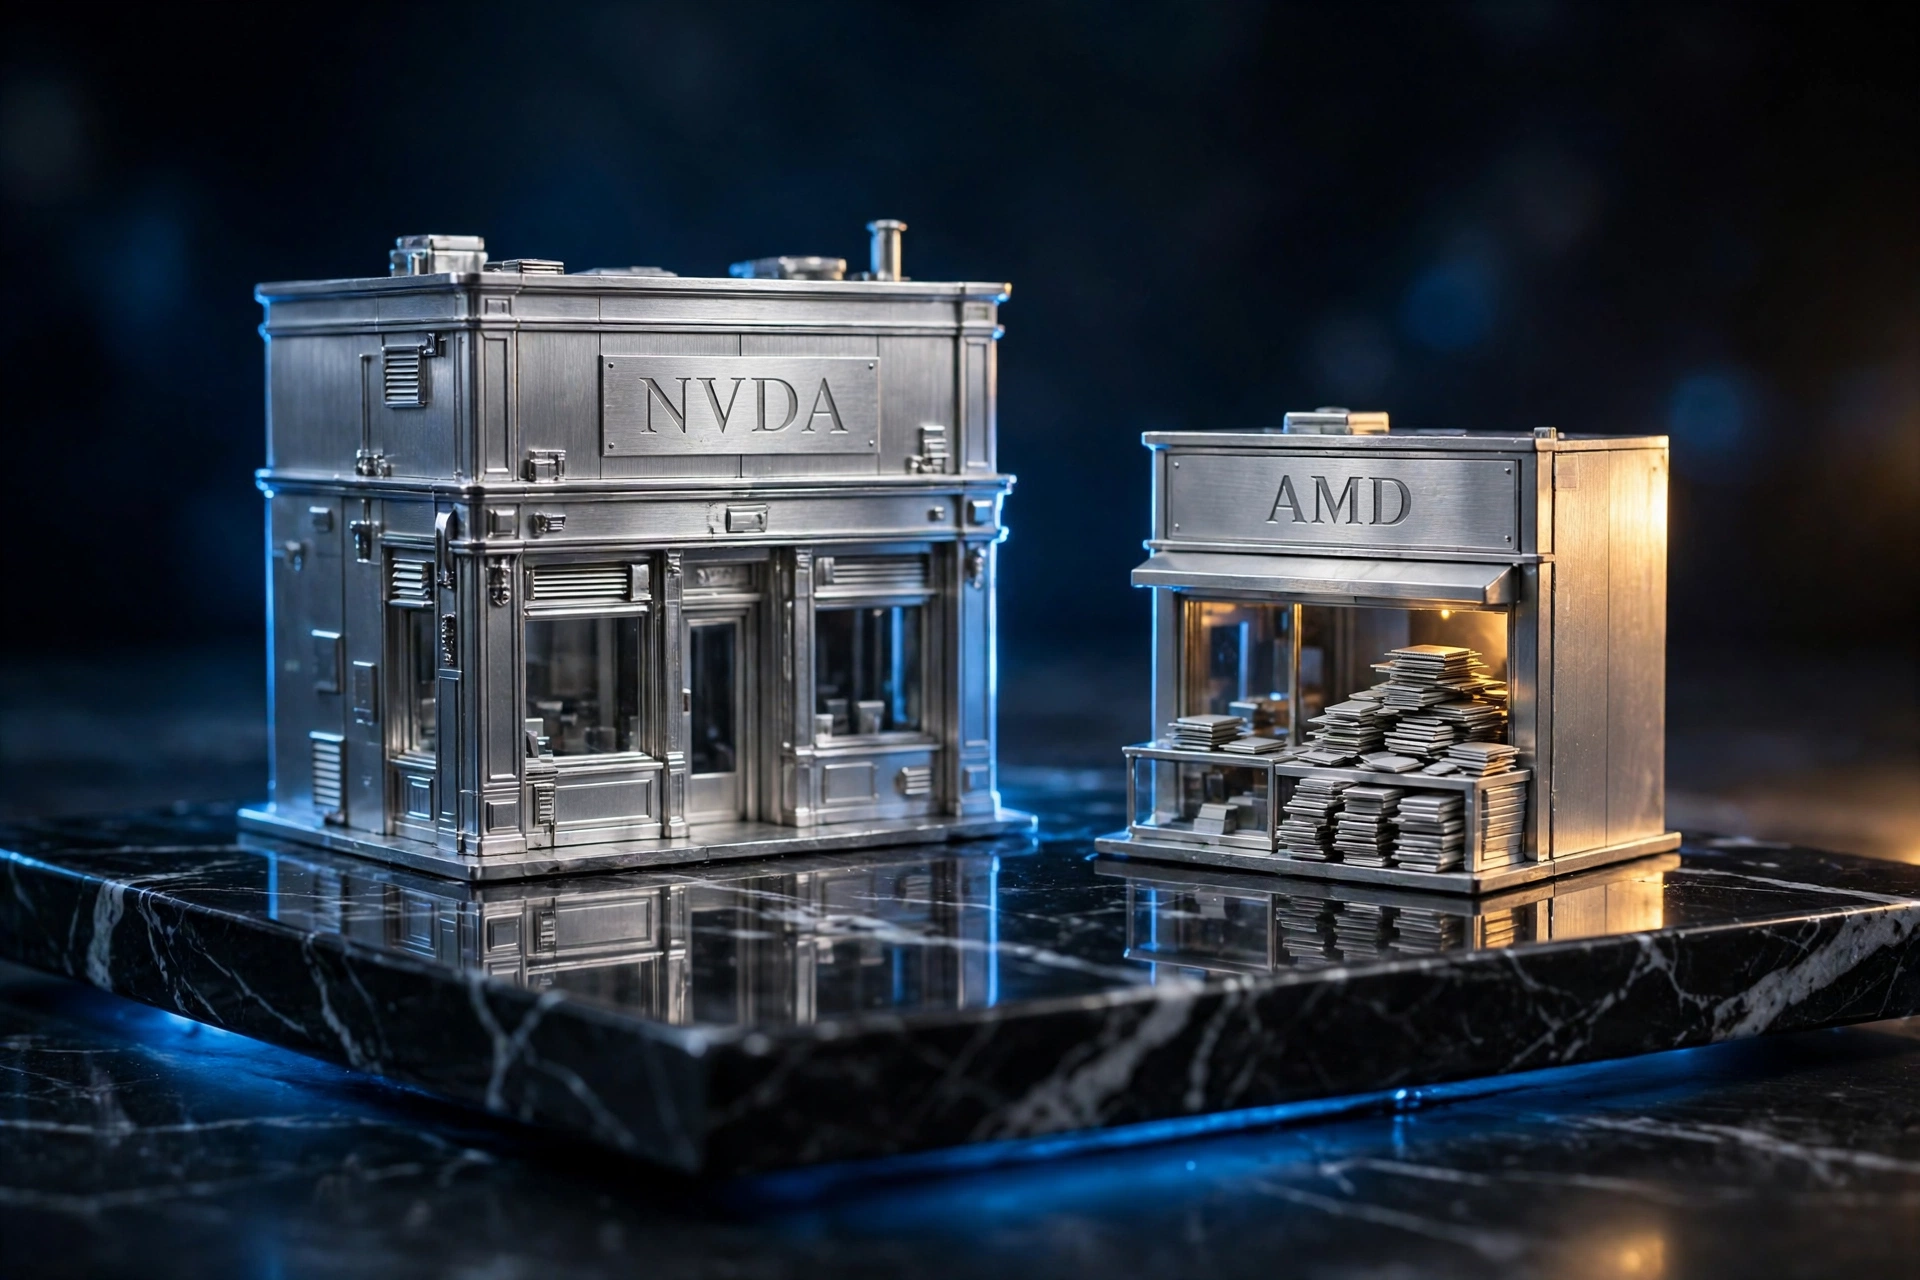
Walk with him to Sim Lim Square, where two computer shops sit side by side.
A fall is a price. A bargain is a price against a business. They are not the same thing.
Ah Huat runs the big shop, there for years, with a long queue. For every dollar a customer spends, Ah Huat keeps about 64 cents. His shop is Nvidia.
Ah Seng runs the smaller shop next door. His sales are growing faster, but for every dollar a customer spends, Ah Seng keeps far less. His shop is AMD.
A fall in price is not a break in the business
On Thursday, 5 November 2026, the Nasdaq fell 5.52%, the S&P 500 fell 4.36%, the Dow fell 3.44%, and the chip index, the SOX, fell 12.25%, all 30 of its stocks down. On Friday, the Nasdaq rose 1.09%, the S&P 500 rose 0.31%, and the Dow fell 0.46%.
Nvidia's business did not break on Thursday. In its second quarter of fiscal 2027, reported on 26 August 2026, revenue was $96.2 billion, up 106% from a year earlier. Data Center revenue was $89.0 billion, up 117%, about 92% of the total. Earnings per share were $2.22, against $2.09 expected.
AMD's business did not break either. In its third quarter of 2026, reported on 3 November 2026, revenue was $13.38 billion, up 45% from a year earlier, a record. Data Center revenue was $8.5 billion, up 97%, about 64% of the total. Non-GAAP earnings per share were $2.09, against $1.95 expected. Client and Gaming fell 8%.
"A fall is a price. A bargain is a price against a business."
Cheaper on price is not cheaper on earnings
A lower share price does not mean a cheaper stock. A $449 share can be more expensive than a $187 share. You have to ask what each dollar of price buys.
Nvidia closed on Friday, 6 November 2026, at $186.64, up 2.78% on the day, after $181.60 on Thursday, down 9.26%, and $200.13 on Wednesday. Over five days it fell 12.65%, over one month 21.4%, and for the year it is up 0.08%. Its 52-week range is $164.27 to $243.37.
AMD closed on Friday at $449.04, up 11.04% on the day, after $404.40 on Thursday, down 17.26%, and about $488.78 on Wednesday. Over five days it fell 20.72%, over one month 30.47%, and for the year it is up 109.68%. Its 52-week range is $188.22 to $658.52.
Look at earnings instead. Nvidia's trailing price-to-earnings ratio is about 23.6 to 25.8 times, and its forward ratio is about 13.1 times. Its earnings per share over the trailing twelve months are $7.91. Revenue over the same period is $303.0 billion. Its net margin is 63.7%. AMD's trailing price-to-earnings ratio is about 97.6 times. Its forward ratio is about 30.9 to 31.7 times. Its earnings per share over the trailing twelve months are $2.65. Nvidia is cheaper for each dollar of earnings it has already made. AMD is dearer, because the market is paying for earnings it has not yet made.
Nvidia figures are from Finnhub and Gekko; AMD figures are from Finnhub, MarketBeat and StockAnalysis, all checked on 6 November 2026.
Morningstar's fair value for Nvidia is $310, up 66.1% from $186.64. Analysts' mean target is $323.45 to $327.14, from 33 to 58 analysts, with a range of $180 to $515. The consensus is Buy or Strong Buy. Morningstar's fair value for AMD is $570, up 26.9% from $449.04. Analysts' mean target is $633.17, from MarketBeat, checked on 6 November 2026. Other aggregators put it at $648 to $670. The range matters, so do not treat one number as settled. The consensus is Moderate Buy.
The two shops, side by side
| NVDA | AMD | |
|---|---|---|
| Price, 6 Nov 2026 | $186.64 | $449.04 |
| Change, 6 Nov / 5 Nov | +2.78% / -9.26% | +11.04% / -17.26% |
| 5-day / 1-month | -12.65% / -21.4% | -20.72% / -30.47% |
| 52-week range | $164.27-$243.37 | $188.22-$658.52 |
| Morningstar fair value | $310 | $570 |
| Analyst mean target | $323.45-$327.14 | $633.17 ($648-$670 elsewhere) |
| Trailing / forward P/E | ~24-26x / ~13x | ~98x / ~31x |
| Margin | 63.7% net | 56% non-GAAP gross (Q3) |
| Next earnings | 17 Nov 2026, after close | Q4 guide ~$17B |
Nvidia: direction down, profit proven
Direction: down. Nvidia's price of $186.64 is below its 50-day average of about $219.81 to $220.64, and below its 200-day average of $204.67 (Gekko, 6 November 2026). A stock below both averages is not in an uptrend.
Structure: the price is 23.3% below its 52-week high of $243.37, and 13.6% above its 52-week low of $164.27. Momentum: Friday's rise of 2.78% covered about a quarter of Thursday's fall. It is a bounce, not a turn.
Next test: earnings on 17 November 2026, after the close. Consensus is $2.47 per share on about $108.8 billion of revenue. Over the past 13 quarters, the stock fell in the week after earnings eight times, including the past four in a row (Motley Fool, 6 November 2026). That does not prove it will fall again.
Invalidation: below $181.60, Thursday's close. A close below that breaks the rebound low. The deeper level is $164.27, the 52-week low. Below that, the story is not a dip. It is a new low.
Target: Morningstar fair value $310, up 66.1% from $186.64. Analyst mean target about $325, up about 74%. Both are targets, not promises.
Reward and risk, after costs: at $186.64, with invalidation at $181.60, the risk is $5.04, or 2.7%. The reward to $310 is $123.36, or 66.1%. That is 24.5 to 1, before costs. To about $325, it is about 27 to 1, before costs. Loss budget: shares equal loss budget divided by ($186.64 minus $181.60). Consider a hypothetical, labelled example only. On a $100,000 portfolio, with a 1% loss budget of $1,000, $1,000 divided by $5.04 is 198 shares, about $36,955 at $186.64.
AMD: growth faster, risk wider
Direction: not verified in this run. AMD's 50-day and 200-day averages were not verified against a source checked on 6 November 2026, so they are marked unavailable rather than estimated. Do not trade on a direction you have not checked. What is verified is the price action. AMD fell 20.72% in five days and 30.47% in one month.
Structure: the price is 31.8% below its 52-week high of $658.52, and 138.6% above its 52-week low of $188.22. For the year it is up 109.68%. Momentum: Friday's rise of 11.04% covered about half of Thursday's 17.26% fall. That is a stronger bounce than Nvidia's. Next test: guidance, not last quarter. AMD guided fourth-quarter revenue to about $17 billion, plus or minus 3%, against about $16.29 billion expected, with non-GAAP gross margin at about 55%. Management expects revenue growth above 80% in 2027. A shortage of HBM memory is already constraining shipments. Zacks, on 6 November 2026, notes Nvidia's return on equity is 96% against AMD's 16.8%, and calls Nvidia the better buy-the-dip on profitability, ranking Nvidia #2 Buy and AMD #3 Hold. That is Zacks' view, not a fact.
Invalidation: below $404.40, Thursday's close. A close below that breaks the rebound low. The deeper level is $188.22, the 52-week low, which is far below. AMD's invalidation is further away, so the risk per share is larger.
Target: Morningstar fair value $570, up 26.9% from $449.04. Analyst mean target $633.17, up 41.0%, with other aggregators at $648 to $670. The range is wide, and disagreement is information.
Reward and risk, after costs: at $449.04, with invalidation at $404.40, the risk is $44.64, or 9.9%. The reward to $570 is $120.96, or 26.9%. That is 2.7 to 1, before costs. To $633.17, the reward is $184.13, or 41.0%. That is 4.1 to 1, before costs. Compare that with Nvidia's 24.5 to 1 to its fair value. The difference is not the target. It is the distance to invalidation.
Loss budget: shares equal loss budget divided by ($449.04 minus $404.40). Consider a hypothetical, labelled example only. On a $100,000 portfolio, with a 1% loss budget of $1,000, $1,000 divided by $44.64 is 22 shares, about $9,880 at $449.04.
A $10,000 split, and what it does not prove
Consider a hypothetical. You split $10,000 evenly. $5,000 into Nvidia at $186.64 buys 26.8 shares. $5,000 into AMD at $449.04 buys 11.1 shares.
Suppose both reach their Morningstar fair values, and nothing else changes. Nvidia at $310 is worth $8,308. AMD at $570 is worth $6,327. The $10,000 is worth $14,635, up 46.4%. That is arithmetic, not a forecast.
Counter-case: if both fall 10% again into Nvidia's earnings, the $10,000 is worth $9,000. The split did not protect you. This hypothetical excludes costs, taxes and dividends, and the possibility that fair values are cut.
"Splitting between two stocks in the same sector is not diversification. It is two bets on the same thing."
What to check before you buy either dip
Do not buy the dip. Check the dip. These are the questions that would make the case stronger, or weaker, for each stock.
What would make Nvidia more convincing? A close above its 200-day average of $204.67. A second day of strength after Friday's bounce. Earnings on 17 November that beat $2.47 and $108.8 billion, and guidance that rises with it. What would make it less convincing? A close below $181.60. A fall in the week after earnings, for the fifth quarter in a row.
What would make AMD more convincing? A close above Thursday's high, then a higher low. Fourth-quarter revenue at or above $17 billion, with gross margin at or above 55%. Evidence that the HBM shortage is easing. What would make it less convincing? A close below $404.40. A fourth quarter that misses its own guidance. A gross margin that slips below 55%.
Back to the two shops
Jason did not buy either shop on Thursday night. He went home and wrote down two numbers for each. The price, and the price that would prove him wrong.
For Nvidia, the number was $181.60. For AMD, it was $404.40. Below those, the dip is not a dip. It is a fall that is still falling.
That is the whole question. Which shop are you paying for, the one that has already earned it, or the one that still has to?
Sources: Finnhub and Gekko for Nvidia price, averages, valuation and market data, 6 November 2026; Finnhub, MarketBeat and StockAnalysis for AMD price and valuation, 6 November 2026; Nvidia Q2 FY2027 results, 26 August 2026; AMD Q3 2026 results, 3 November 2026; Morningstar fair values: NVDA $310 via BeStock, 6 November 2026; AMD $570, raised from $530 on 4 November 2026 (Morningstar, 4 November 2026); analyst targets via MarketBeat, BeStock, Tradestie and Nexqual, 6 November 2026; Motley Fool on Nvidia post-earnings history, 6 November 2026; Zacks on NVDA vs AMD, 6 November 2026. Market-cap figures differ by source and are stated as ranges; 50-day and 200-day averages for AMD were not verified and are marked unavailable. Figures are third-party market data, not guarantees. Educational data, not a buy/sell call.